Insane Hydraulics
Bold and audacious blog about fluid power
The aim of this blog post is not to mock someone's oversights but to encourage hydraulic technicians to get educational value from technical documentation by examining it thoroughly and carefully, including even the small and seemingly unimportant details.
After I published my post on the principles of dynamic load sensing, my attention was brought to a PDF file describing an interesting product from Festo Didactic - a priority valve with dynamic load sensing, specifically tailored as a learning tool - and I thought - "Cool, I should definitely check it out!"
At first glance, the document looked great, but the more I looked into it, the more it felt like "something's not adding up" - you know - like when you are looking at an AI-generated image, and it looks damn near perfect, but then you notice a hand with seven fingers and person with three legs - and you can't "un-see" it anymore.
But you know what? When it comes to technical, and especially didactic literature - discovering things like errors or omissions is a great learning experience in itself (at least when you can reason why you think something is "not exactly right") because this means that a) you pay attention to details, and b) you possess critical thinking.
But before I go into details, let me make one thing crystal clear - Festo Didactic makes awesome products for hydraulics training, and the things I am about to point out are in no way aimed at diminishing their value. I, as a person who has done all kinds of technical documentation for clients, know firsthand how easy it is to make a mistake in a diagram or a technical manual, especially when you are dealing with several other super-urgent projects at the same time, and the docs must be finished "yesterday!"
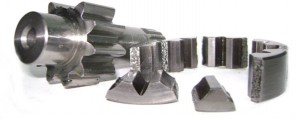
The product I am going to talk about is this dynamic LS priority cartridge valve, mounted in a nice manifold, that can be clamped onto a profile plate of a didactic workstation. Unfortunately, I am not allowed to publish the image (or the PDF file) here because of the (very scary) copyright message that folks from Festo seem to insert in each and every one of their docs - so I will have to rely on external links, and I will kindly ask you to bear with me on this one. I realize how cumbersome it may be to have a separate window to view the PDF file or the web page I am about to reference, but I promise you that it is totally worth it because there's stuff to learn!
The very first thing that "caught my eye" was actually the picture of this product displayed on the respective web page. The image has enough resolution to see that the product (part number 573022) has a sticker that depicts a dynamic LS priority element with two orifices, but the Hydraforce cartridge threaded into the manifold is very clearly marked as EC10-42, which, is actually a static LS valve. Quite strange, isn't it? But we all know how often product images do not correspond to reality - so I guess we can let this one slide.
The most interesting part is, of course, the PDF file with user documentation, and I will kindly ask you to download it from here and have it open in a separate window so that you know exactly what I am talking about (once again - I would love to have the graphs and the diagrams here, but Festo's strict copyrighting policy prevents me from doing it).
The picture on the first page of the PDF, by the way, contains the correct cartridge valve this time - the Hydraforce EC10-43, which, indeed, has dynamic LS. The sticker on top of the manifold, however, is different and represents a valve with three orifices instead of two. Strange again, but not very important - just a detail I felt I should mention. The most educational and interesting part would be the three pressure/flow charts and the hydraulic schematics of an extremely thorough test of a priory valve with dynamic load sensing, so please scroll down to the bottom of page 2.
I want to start with the hydraulic diagram of the test - it's beautiful! There's a flow meter at the pump outlet, a flow meter in the CF (controlled flow) line, another flow meter in the EF (excess flow) line, and a flow meter in the dynamic LS line! And to make things even better - a pressure sensor in each of these lines! This is the best setup one could possibly come up with to see how a priority valve behaves. It is absolutely perfect, in my opinion, and the person who devised it deserves a medal! I, personally, would love to see the flow rate bumped up closer to the nominal value of the cartridge (30 lpm), but I can also see all the reasons why you can't do this on a portable didactic stand - so this is not a problem at all. Also - since the test pressures and the flow rates are so small, I would love to know what kind of flow meters they used and if they introduce any meaningful pressure drop. Getting your hands on a setup like this and playing with it for a while is, by far, the best way to learn how such a valve operates.
And now let us examine the graphs to the left of the schematics. There's seemingly a lot going on there, but if you first get clear on what the axes represent, and then look at the lines one at a time - you will see that it all makes sense, and then realize that, maybe, one of the lines is "slightly off." I think that making sense of such graphs is an awesome mental exercise - it's like solving an interesting puzzle and learning hydraulics at the same time!
Let us first answer the question: "What happened here?" The loading relief valves of the CF and EF were set to fixed values - theoretical 20 bar for the CF line, and 0 bar for the EF. Then the needle valve in the CF line was closed - and this was the "starting position" of the test. Then the pump was turned on, and the values from the 8 sensors (four flow rates and four pressures) were logged while opening the CF needle valve completely and then closing it back again. Then the logged values were represented in the chart, where the X-axis corresponds to the flow rate in the CF line, and the Y-axes represent pressure and flow rate - to plot out the readings from the 4 pressure sensors and the remaining three flow sensors. By the way - the hysteresis loops clearly seen in the curves are what tells me that they logged the values "in both directions" - i.e. 0% -> 100% -> 0% for the needle valve, which is smart.
The green line is the easiest of all - it simply shows the constant flow rate of the pump throughout the test - 3.8 l/min.
The dark blue line shows the flow rate in the EF line, and we can see that when the CF flow rate (the X axis) is 0 (the needle valve completely closed at the start of the test), it reads 3.2 l/min. This may seem strange, especially if you are used to "normal" (static) priority valves that are supposed to divert all of the input flow into the EF when the CF is closed - in other words - why 3.2 l/min and not 3.8 l/min? But this is so because of the flow in the dynamic LS line, which is still feeding the load. Bear in mind - in this test, the LS line is permanently connected to the load. In real-life applications, the directional (or steering) valve would be responsible for venting this line to the tank when the priority flow is not required.
The red line is the pressure of the priority load (LS line), and we can even tell that the loading relief valve has some override - it starts with 8 bar at 0.6 l/min (the flow through the dynamic LS line when the needle valve is closed) and goes up to 15 bar when the needle valve is completely open, and all of the input flow is diverted into the CF port.
The light-blue valve shows the pressure before the orifice (CF port) - and we can see how beautifully the priority spool manages to keep the delta P across the orifice at a constant 10 bar right until the moment when the flow-saturation condition happens - and you see the delta P drop (the needle valve completely open).
The black line shows the almost constant flow through the dynamic LS line which also drops a little when the flow-saturation happens (pressure differential across the orifice drops).
The yellow line shows a very low pressure of 7 bar in the EF line, with 3.2 l/m going through the "unwound" loading valve, dropping to almost zero when the EF stops.
So far so good, right? But what about the gray line - the pressure in the inlet of the priority valve? Its shape, as expected, follows the shape of the pressure in the CF port, but why is it almost 20 bar higher? Priority spools, in my head, are supposed to be under-lapping, so I don't see how it can drop an extra 20 bar "just like that, " especially with this tiny flow rate. I think the gray line is incorrectly drawn off-set for some reason, and it should be lower on this graph - much closer to the light-blue line.
Now that we are more "versed" in what the lines represent, let us move to the next graph - right at the top of page three. This is exactly the same test as before, only now the loading relief vale of the EF port was set to a theoretical 40 bar (there's another mistake in the hydraulic diagram, by the way - they put 40 MPa instead of 4.0 MPa, 40 MPa is a whooping 400 bar!)
I bet you can see the strangeness now, too, can you not? The green, dark blue, red, and black lines are almost exact copies of the previous test - and this seems to be totally correct - why wouldn't they be? But if you look at the pressure in the CF port (pressure before the orifice) - the light-blue line - you will see that now the constant pressure drop of our compensator jumped up to almost 30 bar! And to make things worse - the pressure in the CF at a certain point becomes higher than the pressure in the inlet of the compensator - something that is downright impossible! I think that this time the light-blue line was drawn off-set and it should have been placed some 8-10 bar above the red line - the place where it "rightfully" belongs!
After doing these two graphs - the third one should be easy. The test conditions are a bit different now - the needle valve was set to a fixed value of 1 l/min, and the EF loading valve was bumped up so that the main relief valve mounted at the pump outlet began to open (60 MPa on the schematic, which is, obviously, another mistake). Everything makes absolute sense except for the offset position of the light-blue line - the pressure in the CF outlet. Once again, the graph plots CF port pressure registering an abnormally high delta-P across the orifice (CF pressure - LS pressure), and once again, at a certain point, it becomes higher than the pressure in the P port of the priority valve, which is completely impossible with a passive load. Maybe one of their pressure sensors was faulty?
So - how did you like this mental exercise? I, for one, loved it! And I can tell you that if I had Festo's learning bench - going through these graphs and seeing these "mysteries" would motivate me to run these tests even more, which actually means that this document genuinely excels as a teaching aid! I only hope that they never delete this file or update it because then this post will stop making sense.