Insane Hydraulics
Bold and audacious blog about fluid power
Let us recapitulate what we did with the torque limiting hydraulic pump controls so far:
But there's a better solution - the so-called torque-limiting pump control with hyperbolic characteristics, often referred to as "hyperbolic power control", and this is what we will be simulating today with the help of our lovely interactive pressure/flow graph.
When I first heard the name "hyperbolic power control", I thought it sounded like a term from a Sci-Fi movie. At least to my ears. Like: "Prepare to execute emergency hyperbolic control, Mister Sulu!.." So cool! But, as it turned out, these controls are called hyperbolic because they plot out a perfect hyperbola on the pressure/flow chart - and a perfect hyperbola is exactly what we are after (at least its positive half, if you want to go into specifics) because we want to see pressure times flow equals constant!
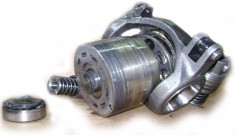
The mechanism that achieves that is pure genius, in my opinion. I wonder who came up with it - must have been a very intelligent person!
It is so simple if you think about it - the actuator that is shifting the spring-biased control spool is placed inside the servo-piston and is acting on it via a lever (or rocker). Since the actuator is now moving along with the servo-piston, the length of the lever is variable, and so is the pressure that is necessary to shift the spool. The magic comes from the fact that there are no "kinks" in our line now, and if you apply the lever law to the actuator, you will see that:
P(spring) x lever1 = P(actuator piston) x lever2
and thus P(actuator) = (P(spring) x lever1)/lever2
Since the P(spring) and lever1 are constants, and the lever2 is our "displacement driven variable", we are getting a nice hyperbolic shape. Another great characteristic of this control is the fact that the spring preset is a simple multiplier, which means that changing it will not bend or distort the resulting torque curve. Like I said - pure genius!
This simulator chart below plots out curves for the function P = setting x r2 / (r1+displacement travel), and the units for the lever size, just like in all previous charts, correspond to the percent of the full travel of the displacement mechanism - for simplicity.
All previous limitations also apply (min charted flow of 10 l/min, max pressure of 300 bar). As you can see, this arrangement works best when the rocker is placed so that its pivot axis is aligned with the sliding actuator at zero displacement, but I introduced the capability of shifting it around to show how the resulting curve would behave. It is very interesting. Happy sliding!